

Usage analysis: a view of real activity
See how equipment is really used
With TelemaTek İM3L, see not only where your equipment is but how much it is actually used. Movement and activity charts reveal hidden inefficiencies and help you manage resources more effectively.

Making sense of every movement
TelemaTek İM3L uses built-in sensors and dedicated analysis algorithms to identify periods of equipment inactivity and operation with high sensitivity.
Activity may come from a running engine, mechanical vibration or direct physical movement. The device stores each movement session in memory, and these records are then used to calculate daily active usage time.
The system presents the data in charts to make usage levels clear.
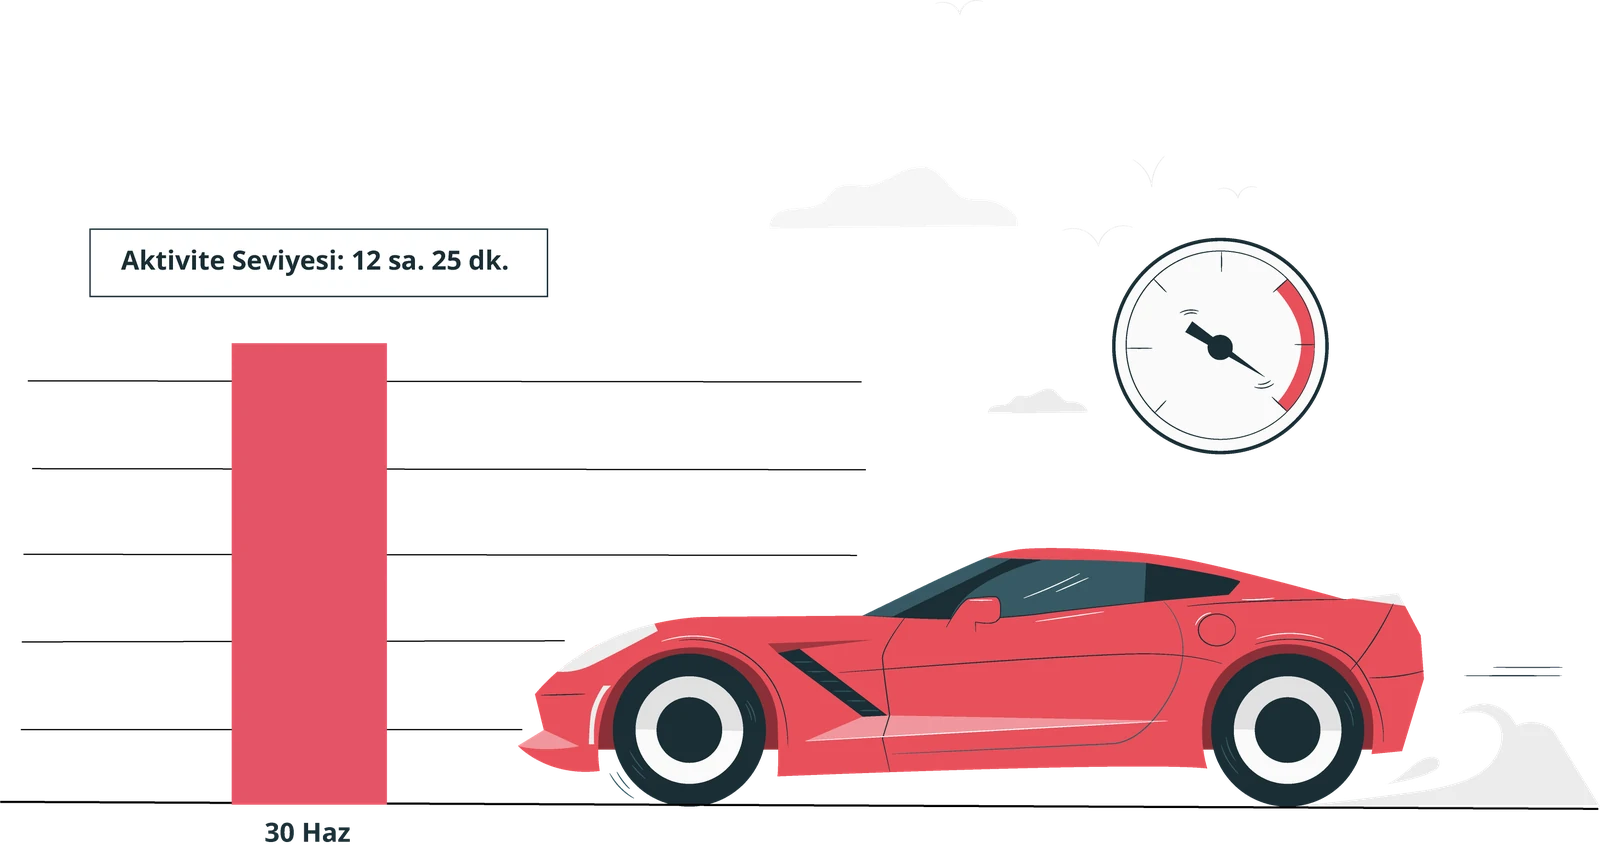
Detailed usage analysis
Unused equipment is more than an idle asset: it is an investment generating no revenue and potentially adding costs. TelemaTek İM3L movement and activity charts show how long a vehicle or equipment was actively used and how long it remained idle.
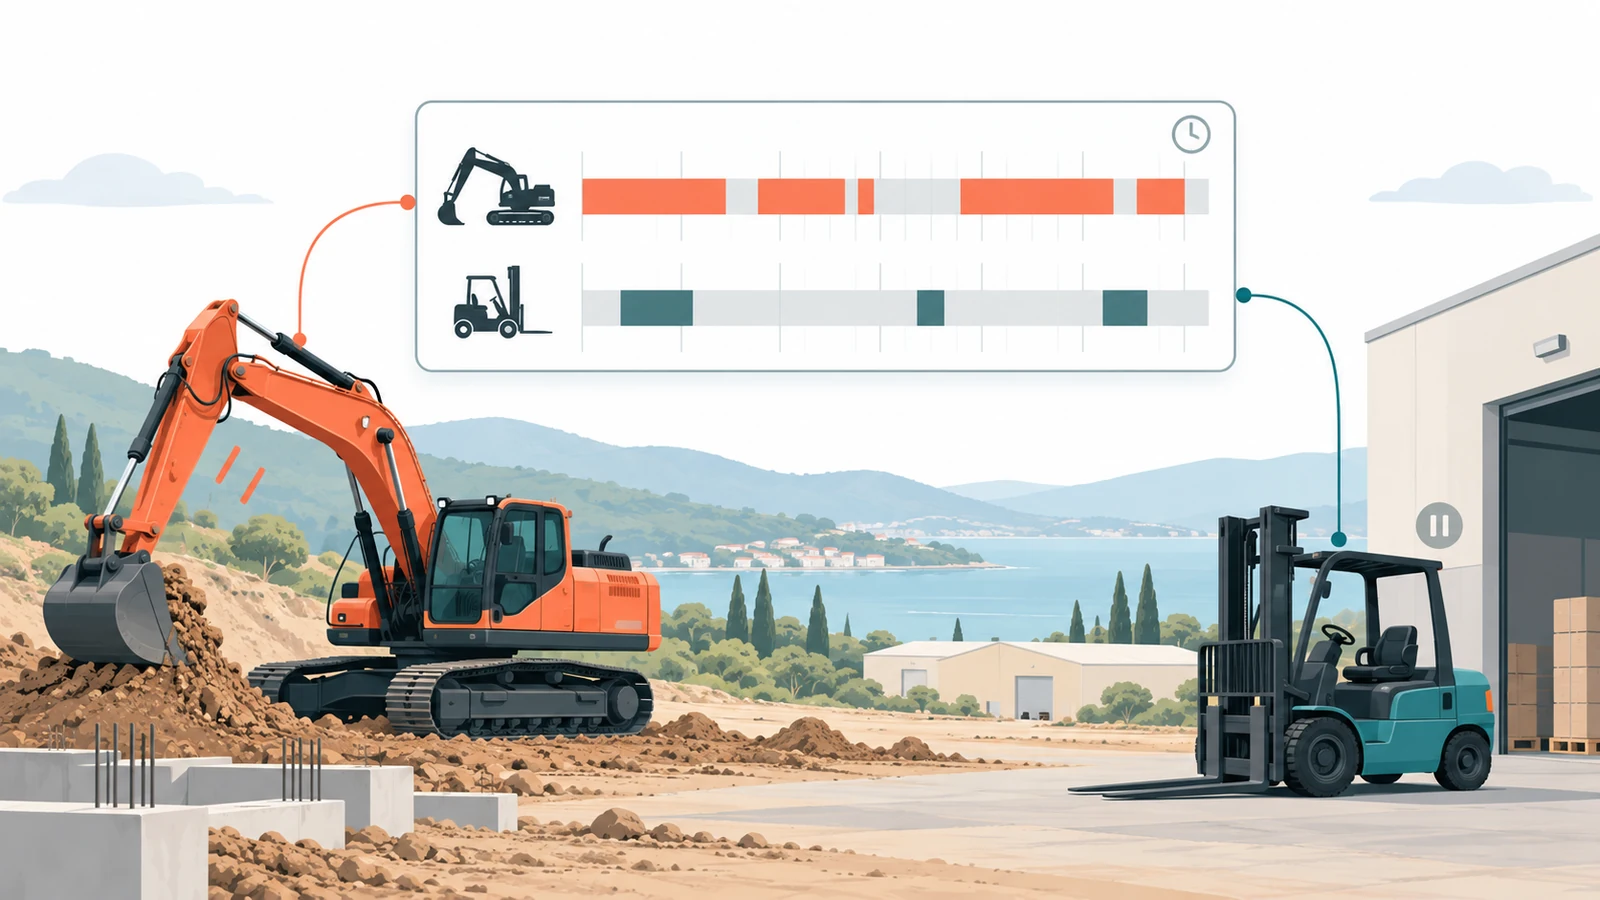
Idle equipment: a source of hidden losses
Timely decisions help avoid unnecessary operating costs and use resources more efficiently.
- Is this asset really needed?
- Could it be reassigned to another project?
- Should planning or resource allocation change?

Where can I see the movement and activity chart?
The movement and activity chart is available for all devices in the user dashboard (panel.telematek.com.tr). Select a date range to review historical movement data in detail.
The system also lets you create automation and reports based on activity data, making it easier to manage usage data and automate recurring monitoring and reporting.
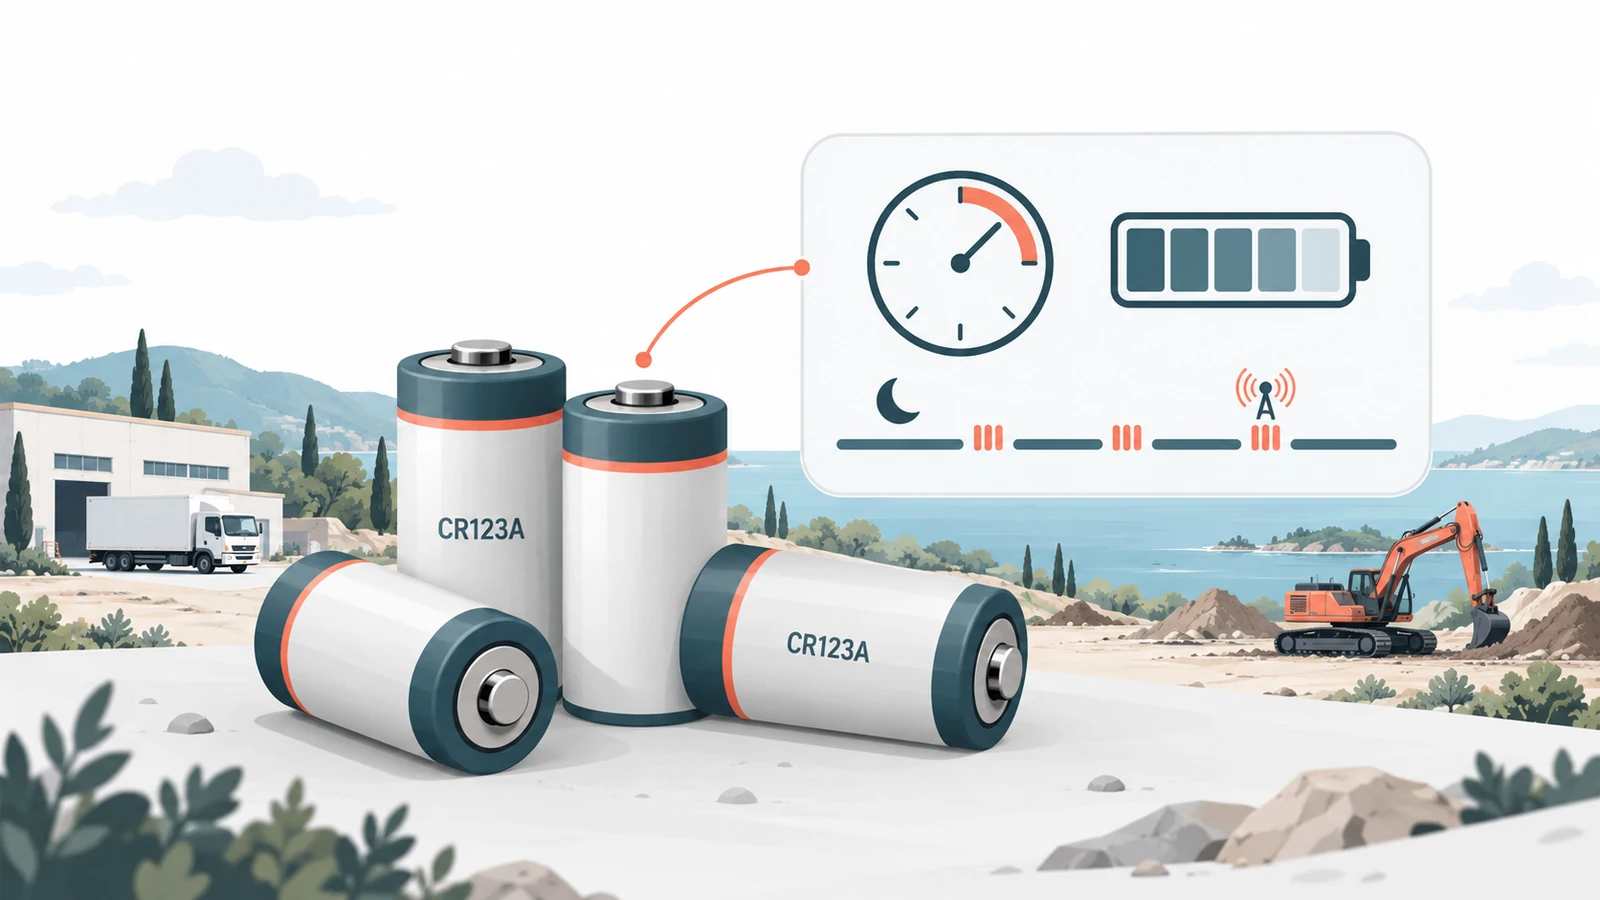
How is long battery life achieved?
Learn how battery choice, transmission frequency and operating conditions affect İM3L battery life.

Temperature charts
Creating temperature charts with the TelemaTek İM3L device.

Easy to use and highly reliable
Learn more about the TelemaTek İM3L device